10+ Customer Satisfaction Metrics for Business Success
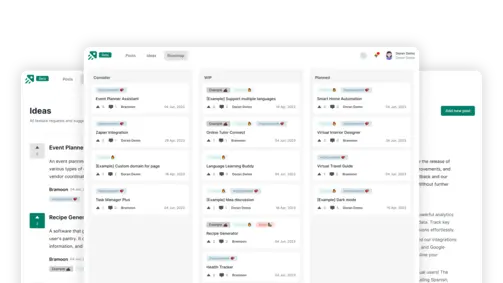
Create changelog and product roadmap for your product
Explore nowTable of contents 15 min
- A Customer Satisfaction Metric: What Is It?
- 10 Crucial Customer Satisfaction Metrics for Monitoring Customer Satisfaction in 2021
- NPS, or net promoter score
- Customer Effort Score (CES)
- Customer Satisfaction Score (CSAT)
- Customer Health Score (CHS)
- Customer Service Satisfaction (CSS)
- Customer Reviews
- Customer Churn Rate (CCR)
- Abandonment Rate
- First Response Time
- First Contact Resolution
Have you ever heard a company claim that they don’t care about their customers’ satisfaction? Most likely not!
Many modern organizations understand the value of customer pleasure, but when you ask them one simple question, “So how do you measure customer satisfaction?,” they become completely lost in confusion.” This blog will undoubtedly assist you if you are in the same boat as the author and are unsure of the customer satisfaction metrics to monitor.
A Customer Satisfaction Metric: What Is It?
Customer satisfaction metrics measuring customer satisfaction provide vital information about how happy your consumers are with your goods, services, or company as a whole. Stated differently, the quality of a customer’s relationship with your brand is reflected in customer satisfaction indicators.
It is important to remember that customer satisfaction metrics show more information than just scores. They make your audience’s insightful beliefs, attitudes, actions, and comments clear.
But what types of metrics measure customer satisfaction? Customer Effort Score (CES), Net Promoter Score (NPS), Customer Churn Rate (CCR), and other customer satisfaction metrics are a few instances of customer satisfaction KPIs.
Even while every metric matters, you still need to make sure they support your company’s objectives. A statistic like the Customer Effort Score, for example, can be given priority if your objective is to develop a straightforward and user-friendly solution.
10 Crucial Customer Satisfaction Metrics for Monitoring Customer Satisfaction in 2021
It’s finally time to get serious now. We have carefully selected the top 10 customer satisfaction KPIs for your team to aim for in 2021 after conducting a ton of research.
NPS, or net promoter score

One of the most often used customer satisfaction metrics to gauge customer happiness is the Net Promoter Score, sometimes known as NPS. NPS is a measure of customer loyalty derived by asking one crucial question of customers:
On a scale of 0 to 10, how likely are you to suggest our company, product, or service to others?”
NPS can assist your company in enhancing the customer experience over time and identifying loyal consumers who can refer you to others, therefore increasing your client base. Let’s now examine this metric’s actual operation.
How Is NPS Calculated?
You must distribute an NPS survey that lets respondents select a number on a 0–10 rating scale in order to calculate NPS. After gathering all of the responses, you must categorize them into three groups: promoters, passives, and detractors.
Use this formula to calculate NPS: NPS = % Promoters – % Detractors
-
Promoters are your most devoted clients (scoring between 9 and 10). They promote your brand and aid in the expansion of your business by convincing their friends and relatives to make purchases from you.
-
Detractors (score ranging from 0 to 6): These individuals are the least likely to suggest your brand to others. They are the hardest to keep around, and occasionally they even turn off other potential consumers.
-
Passives: Those with a score of seven or eight typically adopt a neutral posture. They are not as passionate as brand advocates, and they are also less inclined to spread unfavorable rumors about your company. You can, however, transform the passives into active promoters with a lot of hard work.
Customer Effort Score (CES)

Another well-liked service metric is the Customer Effort Score, or CES, which gauges the amount of work customers put in to engage with your brand, services, or enterprise.
For example, a consumer may find it more convenient to call the phone support service rather than searching through an unorganized knowledge base for a pertinent help article. In the same way, consider other domains, like online product browsing or payment completion.
Today’s consumers want to interact with brands that simplify their lives rather than adding to their already extensive list of problems and complexities, which makes CES even more significant. In actuality, the endeavor serves as a primary predictor of client loyalty.
Let’s now examine how CES functions in practice.
How Is CES Calculated?
It’s time to review the findings after you’ve given your clients access to a CES survey. It is easy to calculate CES because all you have to do is average the responses.
Customer Effort Score (CES) is calculated as follows: Sum of All Scores/Total Number of Respondents
Here’s an example using a 1–10 CES scale to assist us better comprehend this:
Let us assume that 10 clients participate in your CES survey and provide the following customer effort scores: 2, 1, 1, 5, 8, 4, 9, 1, 3, and 2.
(2+1+1+5+8+4+9+1+3+2)/10 = 36/10 = 3.6 is the CES.
More to read: Customer Effort Score Survey: Questions and Tips
Customer Satisfaction Score (CSAT)

One of the best indicators for measuring customer satisfaction is the Customer Satisfaction Score, or CSAT. We’ve all answered questionnaires on our experiences with food delivery, ride-sharing, and other services, after all.
Because every company wants to have more satisfied customers than unhappy ones, the CSAT statistic has grown in popularity over time.
With a score of 85, Amazon leads the list of merchants by customer happiness according to the American Customer happiness Index, followed by Newegg (83) and Costco (83).
Successful brands undoubtedly have high customer satisfaction ratings. Gathering input from customers on your current offerings will enable you to address areas for development and develop into a genuinely customer-focused company.
How Is CSAT Calculated?
Customers can often rate their experience on a scale of 1 to 5 in CSAT surveys. We only take into account replies of 4 (satisfied) and 5 (very satisfied) while calculating CSAT.
The CSAT formula is as follows:

Let’s say that eight of the 10 respondents gave a response of 4 or 5.
80% is the CSAT score (8/10 x 100).
Success is often indicated by a CSAT score of 75% or higher, though this varies by industry.
Find out more: CSAT survey: Definition, Questionnaire, Templates & Examples
Customer Health Score (CHS)

The Customer Health Score is an essential KPI to consider when examining customer satisfaction metrics. Customer success teams utilize the widely used CHS metric to assess whether their clients are at-risk (likely to churn) or healthy (likely to stay). This enables you to carefully divide up your audience and return attention to clients that pose a risk.
Customer success teams frequently have no idea what they are doing; they are either wasting more time on low-value clients who will eventually churn or too little time on high-value clients who expect a continuously excellent experience.
An analysis indicates that U.S. businesses lose around $136.8 billion annually as a result of preventable client attrition.
Thus, before things get bad, the CHS can assist you in identifying at-risk clients and resolving their problems as soon as possible.
How Is CHS Calculated?
Every organization has a different goal when it comes to CHS. For example, one company may want to utilize the data to track the amount of clients dropping out, while another may want to assess how well upselling tactics are working.
The following are some essential components to gauge the client health score:
-
Product usage: How often do customers purchase your goods or services?
-
Depth of use: How many features are customers using in a product or service?
-
Breadth of usage: How many people are utilizing this product or service under a license?
-
Account growth: What is the percentage increase in the amount that clients spend with your company?
-
The amount of engagements with customer service: How frequently do clients have to get in touch with the support staff?
You can add as many components as you’d like to obtain a comprehensive picture of your clients’ health.
Customer Service Satisfaction (CSS)

Customer Service Satisfaction, or CSS, is a tool that helps businesses gauge how happy their customers are with their after-sale support. This metric, which is a crucial measure of customer satisfaction, is determined by giving clients the relevant surveys to complete immediately following their support session.
Measuring the quality of your customer service has become crucial since consumers are gravitating toward companies that offer outstanding customer service.
After just one satisfying customer service encounter, 52% of consumers have returned to a company to make more purchases, according to Dimensional Research.
CSS questions can be distributed via web forms, live chat, pop-ups, IVR, and other methods in addition to online surveys.
How Is CSS Calculated?
As was previously mentioned, clients are sent a CSS question that gives them the opportunity to review your service right away (typically on a scale of 1–5).
CSS Score = Sum of All Ratings/Total Number of Respondents
You can gauge the level of a customer service encounter and your agents’ performance based on the ratings. Agents who score highly, for example, may be given incentives or other advantages. Conversely, agents with lower ratings may receive appropriate training.
Customer Reviews

A consumer’s subjective comments after using and purchasing your goods or service are referred to as customer reviews. Online retailers, social media outlets, review-sharing websites, product comparison sites, and more all offer user reviews.
The success or failure of your brand’s offers can now be determined by the power of customer reviews. The majority of buyers actually intentionally read through hundreds of reviews before clicking “Buy Now.”
A Dimensional Research survey indicates that around 88% of consumers are swayed by internet reviews when choosing what to buy.
Let’s now examine how internet reviews function in real life and how to take use of them.
How Is Customer Reviews Calculated?
Let’s be sincere. Before making any online purchases, we all check online reviews. Even if a product may appear stunning in photos, reviews may tell an entirely different tale.
You should motivate your satisfied clients to post reviews on the internet. By doing this, you can make a good impression on potential clients and guarantee that they make additional purchases.
Here is an example of an email template for an online review request:
Hello, [Name of Customer]
We are happy to hear that your usage of our [Mention Product/Service] is doing well. To make the ideal purchase, a lot of internet users anticipate reading real user reviews.
Would you kindly write a review for us on [Mention Review Site] to share your experiences with such customers?
Please don’t hesitate to get in touch with me if you have any questions. Many thanks for that!
You might be shocked to hear that many satisfied clients will be more than pleased to leave thoughtful evaluations and spread the word about your company. You can even provide these consumers with exclusive discount codes or other benefits in order to promote favorable evaluations.
Customer Churn Rate (CCR)
The percentage of customers who discontinue doing business with your organization is referred to as the customer churn rate, sometimes called customer attrition.
Turnover in business is unavoidable. Some of your customers will inevitably stop doing business with you. But you can determine whether or not churn has reached an alarming rate with the aid of CCR.
Although there are many possible reasons why customers leave a business, there are a few primary reasons that all businesses need to be aware of.

While poor customer service accounts for 14% of customer attrition, poor client onboarding causes 23% of it.
You can identify what is and is not functioning by measuring this parameter on a regular basis. Let’s say you raise the price of your products and observe that the CCR rises to around 30%. This would indicate that your company’s excessive prices are driving away clients.
How Is CCR Calculated?
You need to know how many users there were at the start and the end of the period in order to compute churn for that particular time frame. This is the formula for CCR:
Let’s use an example to better grasp this:
Assume that you have 300 users at the start of April and 150 at the conclusion of the month.
This is how your churn rate would be determined:
50% churn rate is equal to (300-150)/300.
Abandonment Rate
The percentage of clients that left your firm before the intended task could be finished is known as the abandonment rate.
The percentage of consumers that hung up the phone before speaking with a person, for instance, would be your call center team’s abandonment rate. Comparably, the percentage of consumers who quit their shopping carts without making a purchase is known as the abandonment rate if you manage an online store.
Because it demonstrates how happy customers are with their contacts with your business, abandonment rate is regarded as one of the most important customer satisfaction measures.
A low cart abandonment rate indicates to an online retailer that its customers are enjoying a simple and easy checkout process.
How Is Abandonment Rate Calculated?
The effectiveness of a customer’s interactions at different touchpoints is determined by their abandonment rate. Your firm needs to record all of its customer interactions, whether they are successful or not, in order to determine the abandonment rate.
This is the formula for abandonment rate:
Let’s break this down with a straightforward example:
Assume that out of the 500 contacts your call center staff received this month, 450 of them were satisfactorily handled. Your call abandonment rate would therefore be 500 – 450/500 X 100 = 10%.
First Response Time
First Response Time, or FRT, is the length of time (minutes, hours, or days) that your team needs to reply to a request or issue from a customer. You may be wondering how this statistic even affects customer satisfaction at this point.
Well, contemporary consumers anticipate prompt responses from brands to their questions. Their experience might be negatively impacted and their frustrations increased by even a small response delay.
Customers anticipate different things from different channels when it comes to receiving a response from your organization.
A Statista study indicates that while 62% of consumers are content to receive an email response within 24 hours, 77% of customers want an instant response via live chat.
In order to satisfy customers and raise customer satisfaction, you must therefore lower your average first response times.
How Is FRT Calculated?
Calculating your first response time is quite simple when your staff doesn’t receive many consumer requests.
Add together all of your FRTs during a specific time period and divide that sum by the total number of tickets that were resolved during that time period to find the average FRT.
Let’s consider an example where your team resolved 500 tickets in May and it took 20,000 seconds to share the first response.
FRT = 20,000 ÷ 500 tickets that were resolved = 4000 seconds, or 66.66 minutes
Now, when your team responds to hundreds of tickets per month, things might get chaotic. You may automate this process in such a situation and check your team’s average first response time with just one click by using a help desk ticketing system.
First Contact Resolution
An additional crucial indicator of customer satisfaction is First Contact Resolution, or FCR. The percentage of tickets that are resolved by your team during the initial contact with the customer is known as FCR.
When it comes to phone calls or live chats, first-party resolution (FCR) denotes that the customer’s issue is handled before they end the call or end the chat session.
Customers will likely stop doing business with you permanently if they have to get in touch with you more than once to receive a straightforward solution to their issue.
You can, however, always search for ways to raise your FCR in order to prevent such a circumstance. For example, you can provide your lower-tier agents with the authority and knowledge to handle problems independently, avoiding the need to escalate situations to their superiors.
How Is FCR Calculated?
As long as you know how many problems you fixed during the initial contact, calculating your FCR is easy.
This is the formula for FCR:

Let’s use an example to help us better comprehend this.
Let’s say that in a given month, your team dealt with 8500 client complaints, 4200 of which were handled on the first visit.
FCR = 4200/8500 X 100 = 49.4% in this instance.
It’s crucial to keep in mind that you should aim for customer satisfaction metrics that are pertinent to your company’s objectives. Pursuing material that does not contribute to meaningful, quantifiable change is useless. Customer comments and views must be pertinent to the health of your brand. We are confident that these measurements will improve the customer experience and help you understand what makes your consumers satisfied.
What to not miss out on our blog
Gain insightful knowledge and invaluable experiences from dedicated experts.
CRM System Explained: Benefits, Types, and How It Works
Discover everything about CRM system. Learn the benefits and how a CRM system works to improve customer relationships and streamline business operations.


Are you ready? Start your free trial today.
Enhance communication, keep track of the progress, understand customers' insight and more by taking your first trial on Doran.
Sign up for free